

The right figures.
We agree on what each KPI means and how to calculate it, so you know what you are looking at and can compare figures.
04 / DASHBOARDING
We build Power BI dashboards that show what is happening and where you need to take action. Understandable for the people using them, connected to the data you already have.
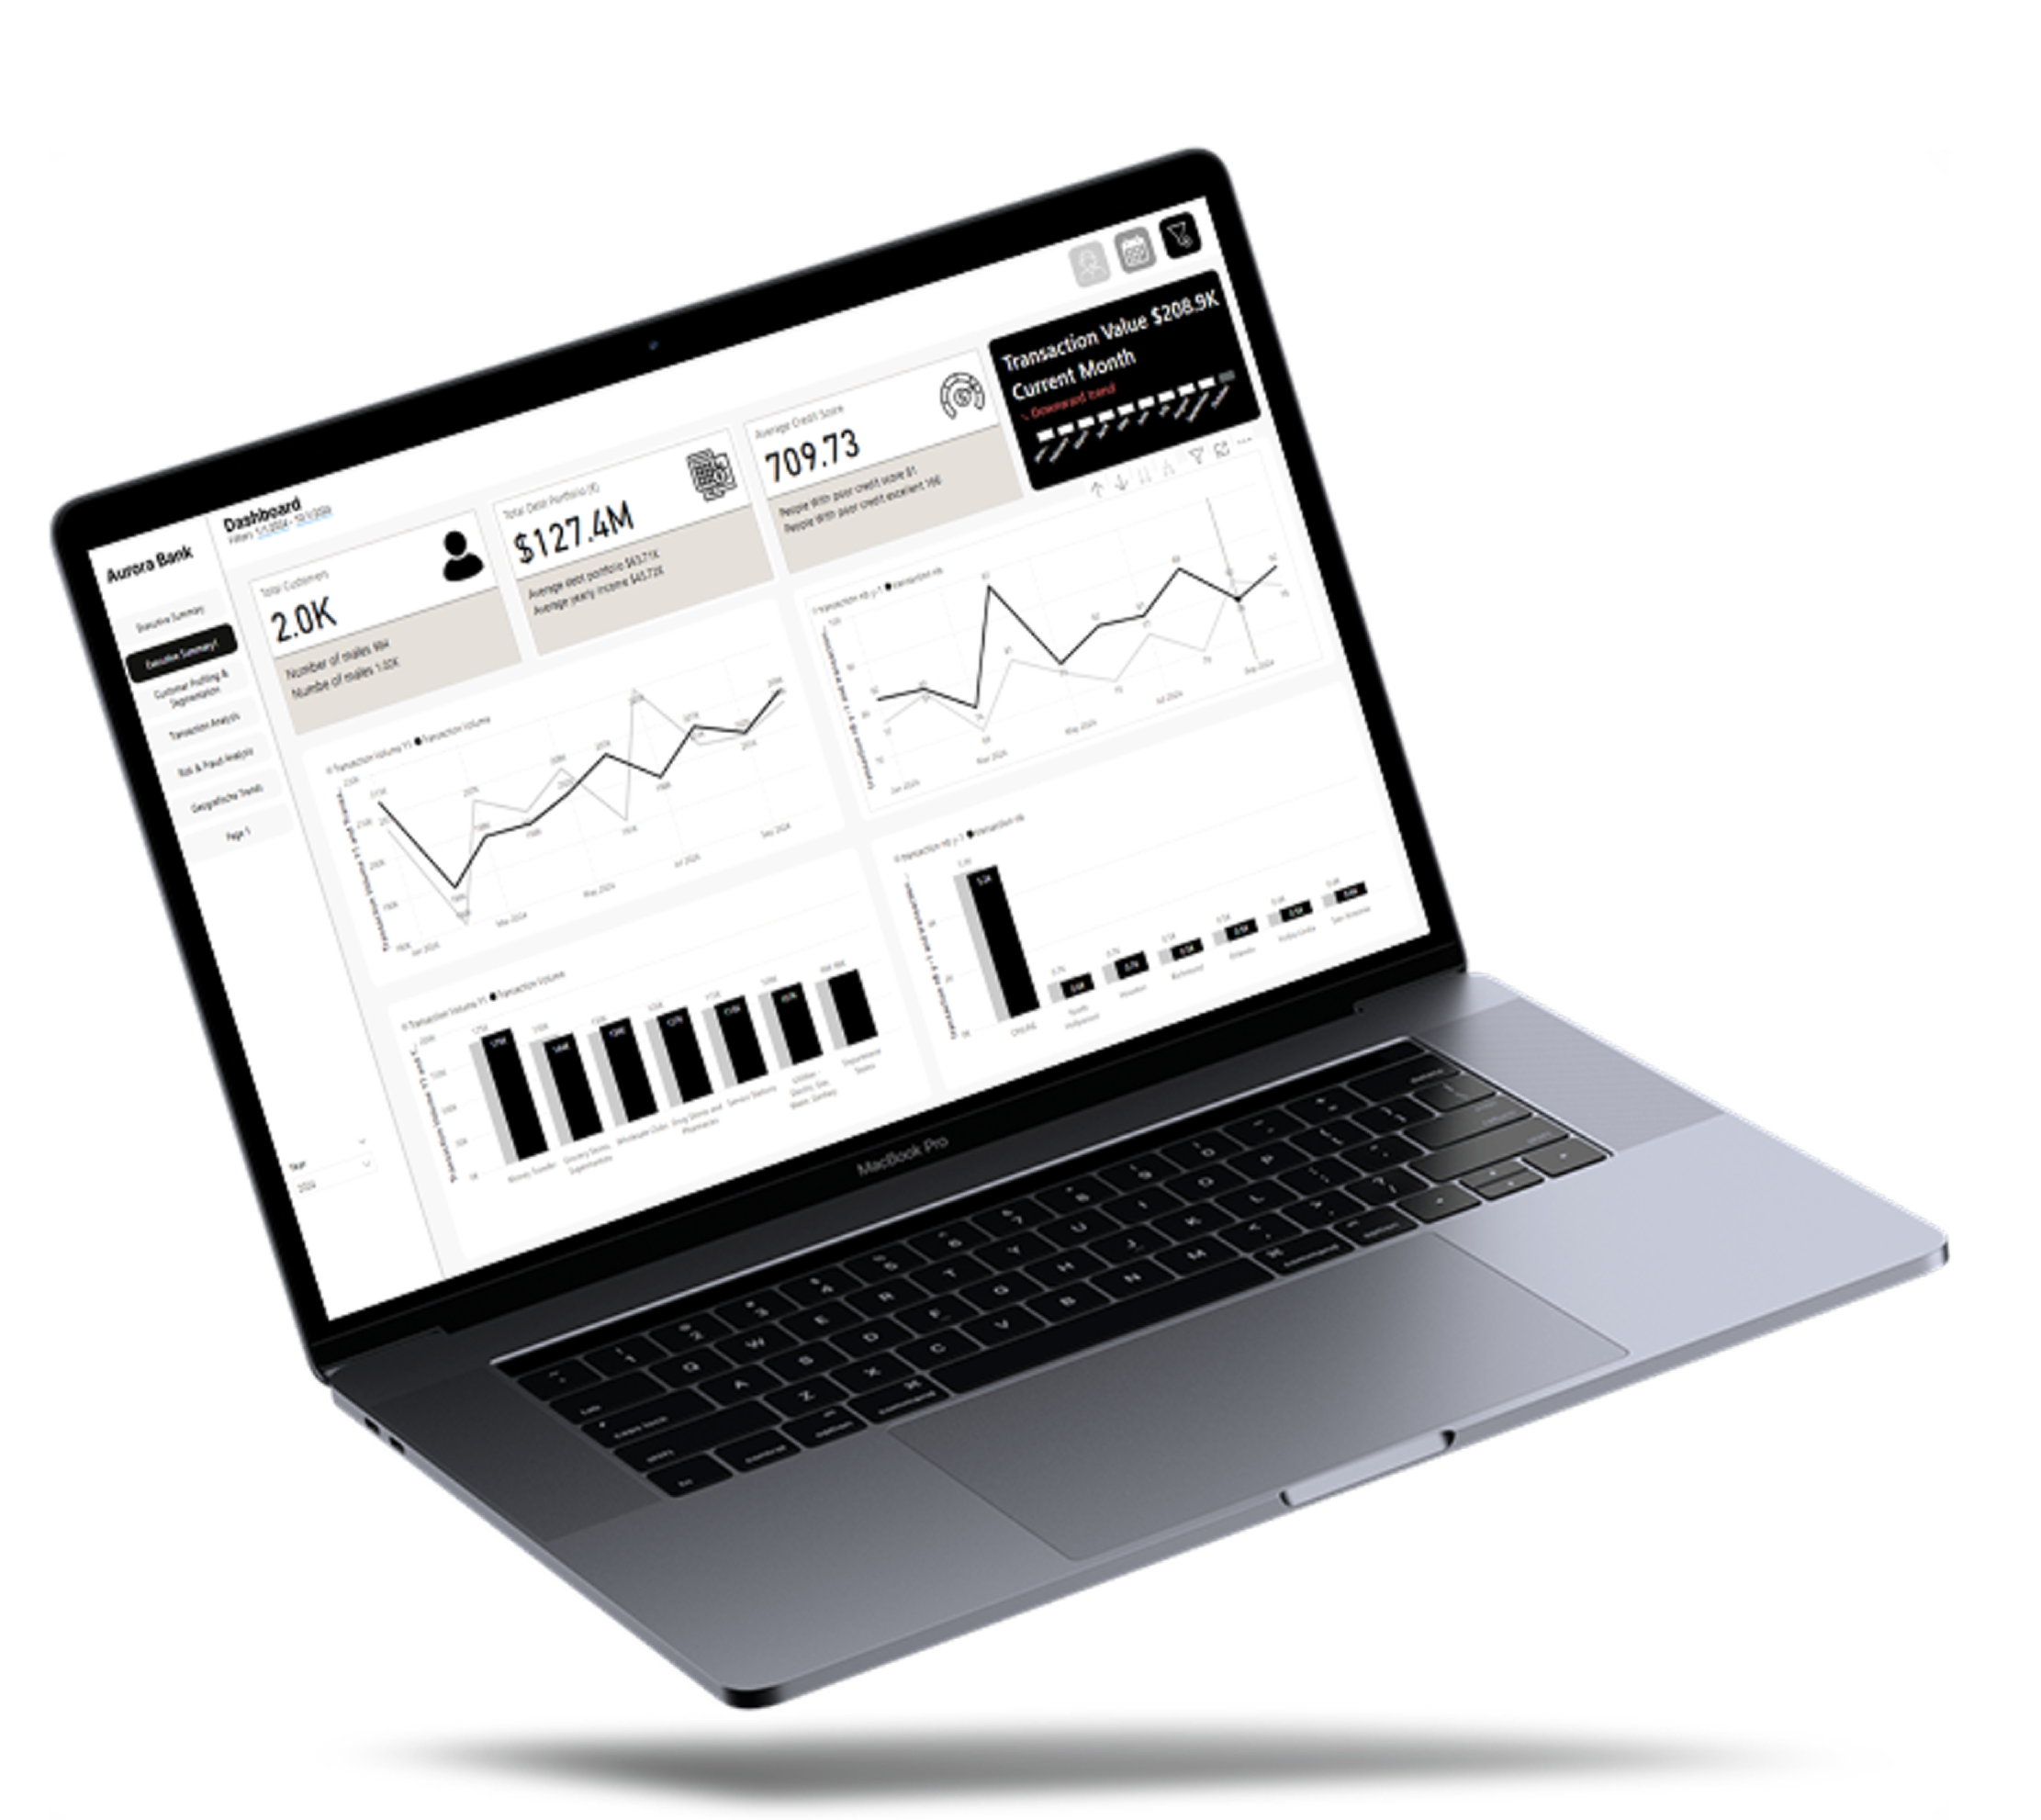
WHAT WE BUILD
A dashboard starts with a question. What do you want to know, which figures matter, and what will you do with the answer? That is what we build the report around.
We agree on what each KPI means and how to calculate it, so you know what you are looking at and can compare figures.
We create a clear layout in Power BI, with filters and detail pages where useful. You see the big picture and can investigate a variance.
We check the results together, configure appropriate access and refresh settings, and explain how to use the dashboard.

THE QUESTION FIRST. THEN THE CHART.
I’m Floris. You do not need to bring me a technical design. Show me the information you are missing or the Excel file you recreate every week. Together, we work out what a dashboard needs to solve.
Is your data foundation already in place? Then we build on it. If sources need connecting or figures need cleaning up first, we make that clear upfront. We build what is needed.
View the dashboard casePRACTICAL QUESTIONS
Yes. If your data is already available and usable, we work with it. Dashboarding can be a standalone project, without a new data foundation or automation project.
That depends on how you want to use and share the dashboards. We discuss the required licences and any costs before setting up the solution.
LET'S GET ACQUAINTED
Bring your question or current report. We will explore what a Power BI dashboard could do for you.